Geospatial Analysis of Carbon Offset Projects: EldHollow's Approach and a Broader Scientific Outlook
August 12, 2026
We're building a way to measure the world's forests honestly, at the scale the climate challenge demands.
The world has committed to protecting and restoring nature at an unprecedented scale. Whether that commitment delivers what it promises comes down project execution on the ground. Local socioeconomics and forest ecology intertwine to create complex challenges for projects to overcome during implementation, and at the end of the day, projects boil all of these complexities down to one single unit: the carbon credit. So the question becomes: can we actually measure what is happening to a forest, accurately and honestly, and everywhere at once?
For a long time, the honest answer has been no. Historically, many forest carbon projects overstated their impact. Usually it was because the baseline was too generous, or because the measurements underneath were flawed. For anyone with a stake in nature markets, that uncertainty is one of the core risks.
Robust geospatial analysis can help mitigate that risk. If you treat a carbon credit as what it really is, a scientific claim, then we can hold it to that standard and assess it objectively. EldHollow's geospatial pipeline turns satellite data and ground truth data into models about how much forest is standing, how it is changing, and what might put it at risk in the future. The pipeline does this anywhere on Earth.
Here is how it fits together, and where it goes next.
For decades, mapping forests from space meant assembling images from many satellites by hand, correcting each sensor's quirks, patching over clouds, and stitching the years together so they lined up. It worked, but it was slow, brittle, and it had to be rebuilt for every new region. EldHollow's initial geospatial pipeline was built on this type of structure, and while it was functional and produced reasonable model results it often required close scrutiny and constant refinements.
Then Google DeepMind developed a single, unified view of the planet called AlphaEarth. For every ten-meter patch of ground on Earth, each year beginning in 2017, it takes the plethora of raw satellite data (optical, radar, spaceborne LiDAR, climate, elevation) and distills it into a compact 64-number matrix for each pixel. The messy work of reconciling sensors, filling gaps, and keeping things consistent from year to year has already been done once, for the whole planet. Google has committed to updating its AlphaEarth dataset every year for the time being, which will allow for continuous observations over time using a consistent data source.
That is what makes scalability possible. Because AlphaEarth's data is formed from the same foundation everywhere, a model we train over the Amazon runs, unchanged, over temperate rainforest or the boreal north. Nothing has to be re-engineered for each new geography, which is exactly what measuring nature at a global scale requires. Now, the AlphaEarth data is not a perfect product. It still has its flaws and results in models that are only slightly better than most custom analysis pipelines. The advantage is that most of the data processing is done for you, and the data is available worldwide.
EldHollow builds several important datasets on top of that foundation.
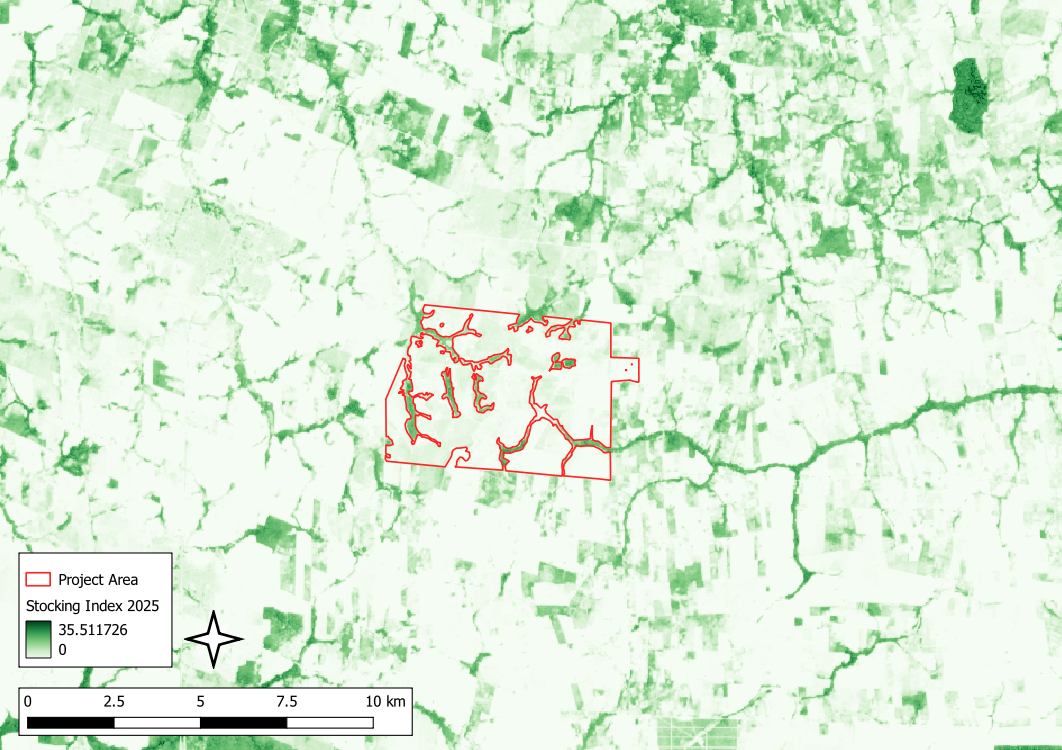
Two models measure the structure of a forest, pixel by pixel and year by year: how much of the ground sits under tree cover, and how tall that canopy stands. We anchor them to the best independent truth we can get. For height, that is NASA's GEDI mission, which fires lasers from the International Space Station straight down through the canopy to measure its height directly, hundreds of millions of precise points around the world. And where a region has its own airborne LiDAR, flown by aircraft or drone, we fold that in as well. LiDAR is the gold standard for canopy measurement, and where it exists it sharpens the model. These models derive EldHollow's stocking index: a living, wall-to-wall map of forest structure in every corner of a landscape, refreshed each year. Everything else is built on top of it.
An example of EldHollow's stocking index showing forest structure inside and surrounding a project area.
Uncertainty and the limitations of geospatial analysis
Anyone can build a model that looks good on a map, and many organizations will market faulty geospatial products as being more robust than they really are. The harder question, and the one that matters, is whether the product is honestly accurate. EldHollow has devoted considerable time and resources into calibration, validation, post-processing, and estimating uncertainty to ensure our models are reliable and taken in their proper context.
We validate the way the science demands. It would be easy to test a model on data right next to where it learned, but nearby places look alike, so that flatters any model. Instead we hold out whole regions and see how the model does on forests it has never seen. When a model forecasts forward in time, we judge it the way you would judge a weather forecaster, on the years it never got to study. And we calibrate against reality, correcting the numbers so they mean what they say. Left uncorrected, models like ours tend to underestimate the tallest, most carbon-dense canopy, so we correct for exactly that.
Still, no model is perfect, and we are clear about our models' limitations. Every estimate comes with its uncertainty, and every model ships with its assumptions and its limits made as clearly as possible to the end-user. We would rather show an honest assessment of model accuracy than make unfounded claims about the model's quality. For example, EldHollow's models suffer from saturation like most other satellite-derived forest structure models, though the intensity of saturation varies from region to region. This is more an artifact of data quality than anything else and will continue to plague the remote sensing field until better data sources become available.
Deriving a baseline
A credit does not reward a forest for standing. It rewards a forest that would otherwise have been harvested or would not have grown in the first place. Working out that alternate history, the baseline, is the most scrutinized step in all of carbon accounting, and it is where many projects have failed in the past.
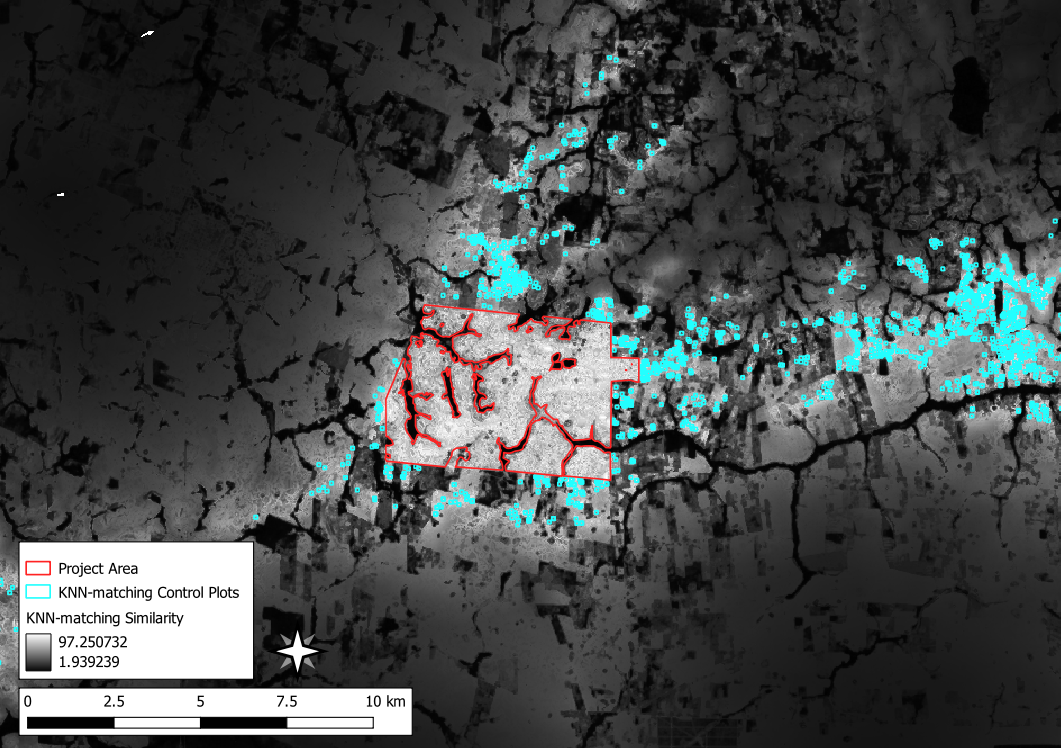
We build a baseline to compare against the project's directly. First, a machine-learning model learns what actually drives deforestation or forest growth in a given landscape: the terrain, the roads and settlements, how close a place is to access, the condition of the forest itself. Then we search the surrounding area for places that closely match the project on those drivers, using the same matching techniques that economists and medical researchers use to build fair comparisons. We follow those matching areas over time as a stand-in for what the project's land would probably have experienced, on average.
Then we try to break the comparison. Did the project and its match really look alike, and did they move together, in the years before the project began? Do the conclusions survive when we change the assumptions? If the counterfactual is shaky, we would rather find out before a credit is issued than after.
An example of how EldHollow's matching control plots used to derive a baseline are located in similar areas to the project.
Growth and loss, watched year by year
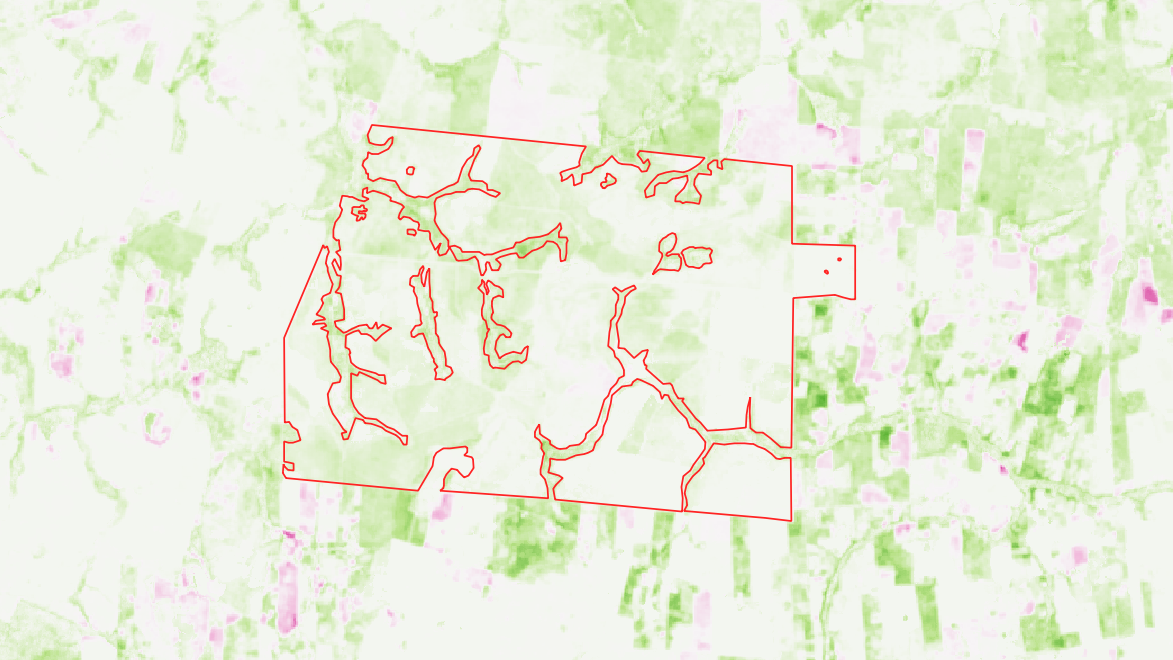
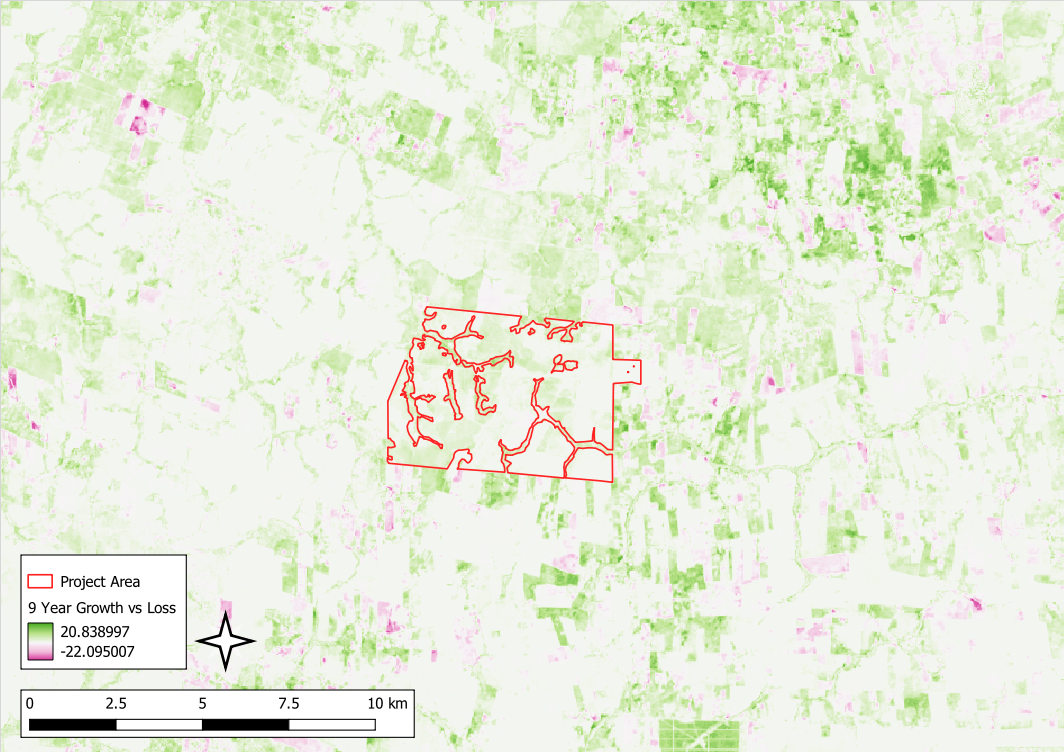
Carbon only counts if it lasts, so the pipeline does not stop at a single snapshot. Every year it looks for change in both directions. It catches loss, whether that is fire, outright clearing, or the slow thinning of degradation. It also catches growth, as forests put on height and cover through recovery or active restoration.
That two-sided view matters more than it might sound. An avoided-deforestation project lives or dies on the loss it prevents, but a reforestation or improved forest management project is defined by the carbon a forest gains. Measure only what disappears and you miss half of what these projects are for. On top of this, we estimate the annual risk of fire for every forest pixel, grounded in the historical record, so the pipeline becomes an ongoing account of a landscape rather than a one-time report. It can raise a flag as risk builds, and register change as it happens.
Regional growth and loss as measured by EldHollow's stocking index.
Analyses in development
Everything mentioned so far is operational in EldHollow's geospatial analysis pipeline today, but several new analyses are currently in development. The most interesting thing about measuring the living structure of forests everywhere, every year, is what it makes possible to observe on the landscape.
Start with forest connectivity. EldHollow's stocking index is, in effect, a map of habitat quality across a whole landscape. Read it the way ecologists do, with dense forest easy for wildlife to move through and cleared land acting as a barrier, and you can trace the corridors that hold a landscape together, measure where it is breaking apart, and show whether a project is reconnecting nature or leaving isolated islands of it. As markets for biodiversity and nature-positive outcomes take shape, that kind of evidence, drawn from data we already process, becomes valuable in its own right.
A few other directions follow from the same foundation:
- Catching degradation, not just clearance. A yearly record of forest structure can pick up the quiet losses, like selective logging and thinning, that simple "forest or not" maps miss entirely. Those quiet losses add up to a large, under-counted share of emissions. - Proving co-benefits. Structure, connectivity, and disturbance history combine into real evidence of habitat and community value, which is the substance behind nature-positive claims. - Beyond forests. The approach is not limited to forests. The same foundation extends naturally to mangroves and other coastal "blue carbon" systems, to grasslands, and to wetlands.
Why it matters
A market that works for nature needs measurements the everyone can trust. These include the carbon that is there, the carbon that would otherwise be lost, and the durability risks that could undo a project's hard work. We think this is, at its core, a scientific problem, and that solving it with rigor, honesty, and global reach is the right thing to do. It is a start, but there is so much more work to be done.
Further reading
A few places to go deeper on the science behind this work:
Brown, C. F., et al. (2025). AlphaEarth Foundations: An embedding field model for accurate and efficient global mapping from sparse label data. arXiv. The global satellite-embedding layer our pipeline is built on. https://doi.org/10.48550/arXiv.2507.22291
Dubayah, R., et al. (2020). The Global Ecosystem Dynamics Investigation: High-resolution laser ranging of the Earth's forests and topography. Science of Remote Sensing. NASA's GEDI spaceborne lidar, our canopy-height reference. https://doi.org/10.1016/j.srs.2020.100002
Lang, N., et al. (2023). A high-resolution canopy height model of the Earth. Nature Ecology & Evolution. Mapping forest height globally from satellites. https://doi.org/10.1038/s41559-023-02206-6
Ploton, P., et al. (2020). Spatial validation reveals poor predictive performance of large-scale ecological mapping models. Nature Communications. Why we validate on unseen ground rather than the data next door. https://doi.org/10.1038/s41467-020-18321-y
West, T. A. P., et al. (2023). Action needed to make carbon offsets from tropical forest conservation work for climate change mitigation. Science. The scrutiny of baselines and credit integrity that motivates our approach. https://doi.org/10.1126/science.ade3535
Cook-Patton, S. C., et al. (2020). Mapping carbon accumulation potential from global natural forest regrowth. Nature. How quickly recovering forests take up carbon. https://doi.org/10.1038/s41586-020-2686-x
McRae, B. H., et al. (2008). Using circuit theory to model connectivity in ecology, evolution, and conservation. Ecology. The connectivity modelling our stocking index can feed. https://doi.org/10.1890/07-1861.1
Geospatial Analysis of Carbon Offset Projects: EldHollow's Approach and a Broader Scientific Outlook — EldHollow LLC